
Home > tyGraph Support Articles > How We Measure Change at tyGraph
この記事をダウンロードHow We Measure Change at tyGraph
tyGraph uses several types of change calculations to help you understand trends over time:
- General change (
% Change) - Period over Period (
PoP%) - Month over Month
- First vs Last Full Month
- Year over Year
The sections below explain how each calculation works.
General Change
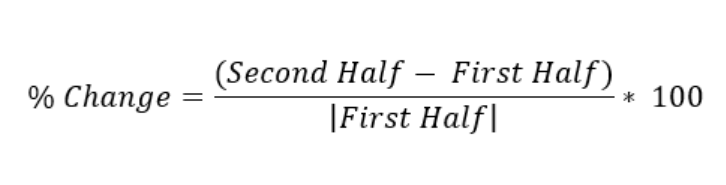
In tyGraph, the percentage change of a measure is often shown as % Change. We calculate this value by comparing the first half of the selected time period with the second half. This approach allows us to calculate change across any date range, using only the data visible in the report, while also smoothing short-term fluctuations.
Where:
First Half: The measure value for the first half of the days in the selected report period.
Second Half: The measure value for the second half of the days in the selected report period.
Example:
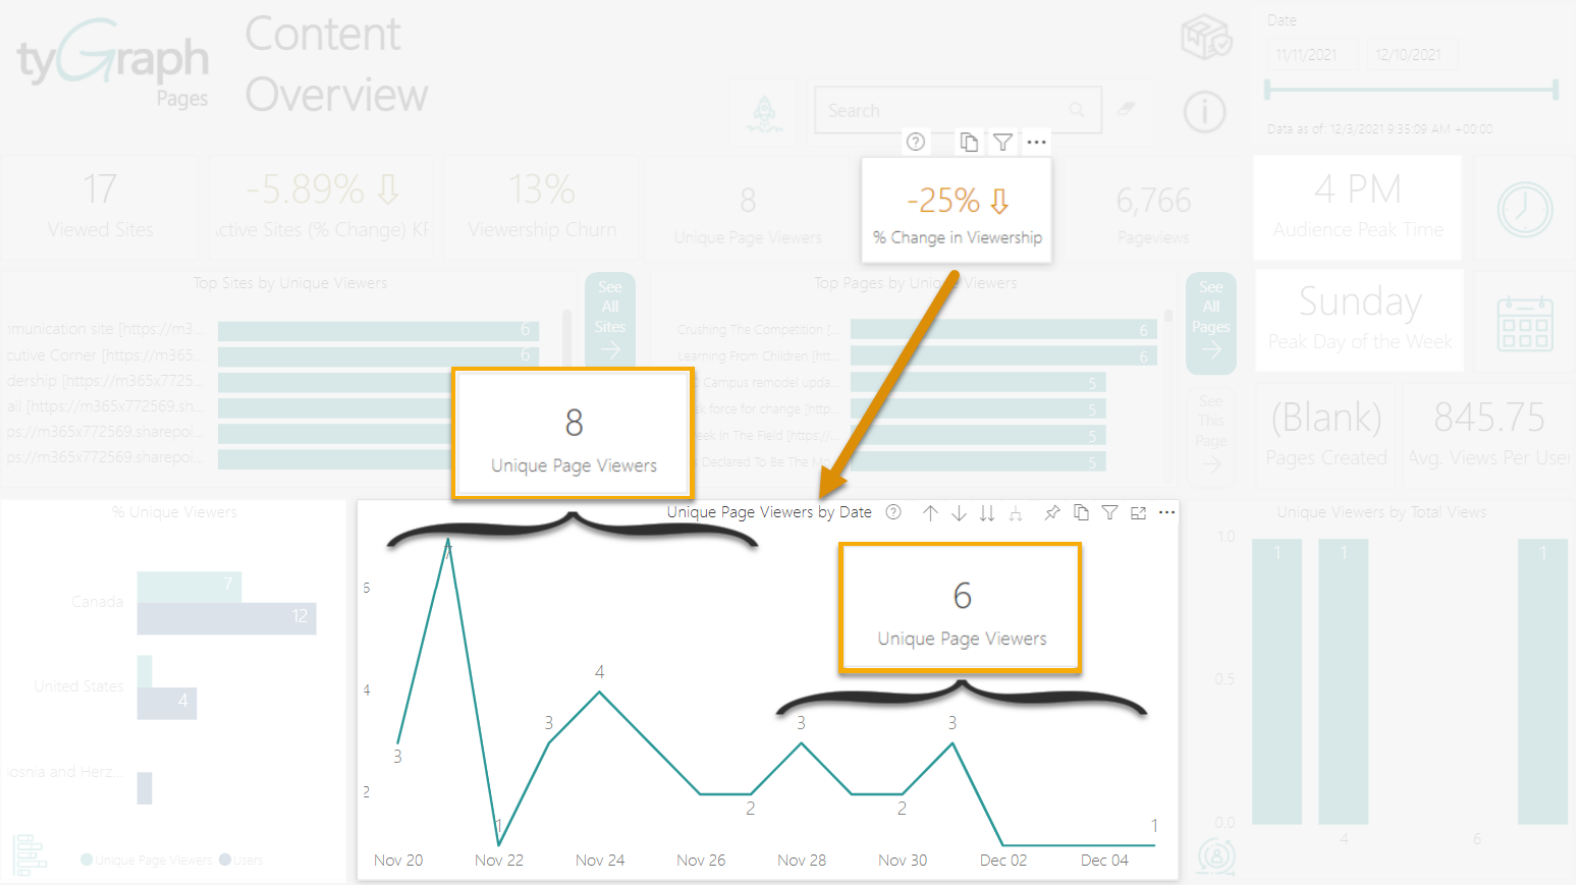
In the example below, there were 8 unique viewers in the first half of the period and 6 unique viewers in the second half, which results in a 25% decrease.
Period over Period (PoP%)
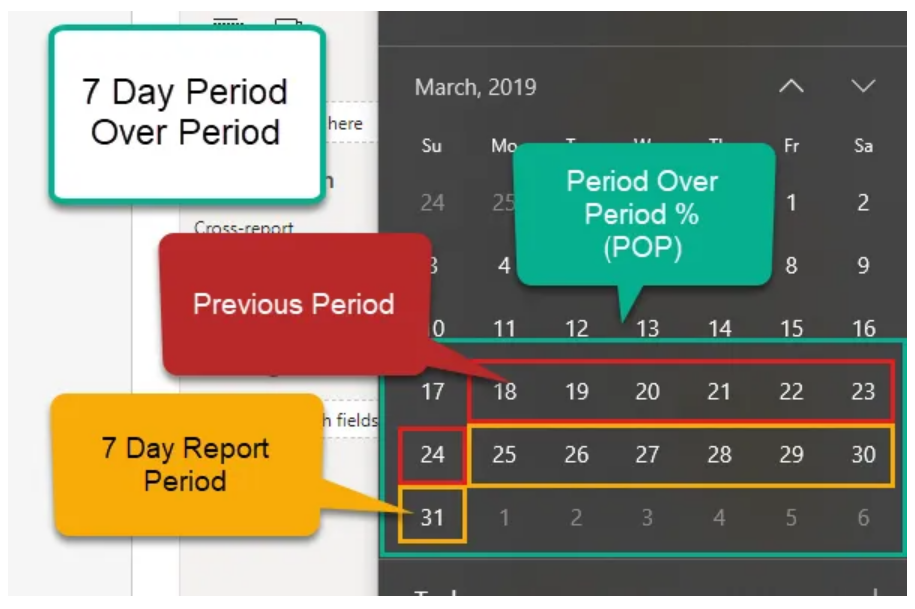
This measure compares the current time frame with the immediately preceding parallel period and calculates the percentage increase or decrease. For example, if the report is filtered to the last 7 days, the comparison uses the 7 days immediately before the selected range.
If the current time frame is March 25, 2019 through March 31, 2019, then the previous comparison period is March 18, 2019 through March 24, 2019.

Month over Month
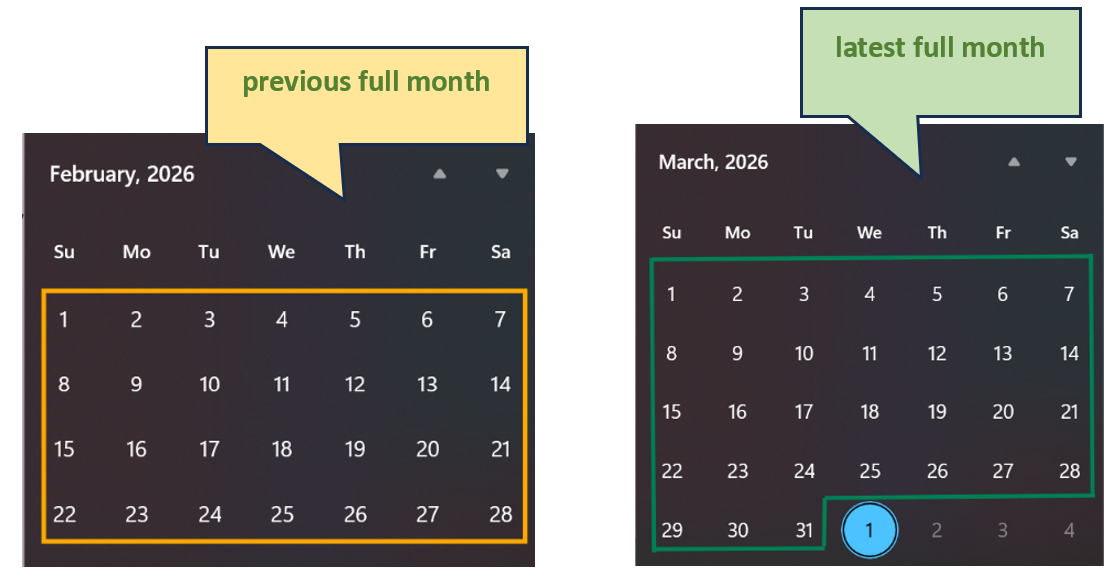
Month over Month compares the latest full month in the selected date range with the previous full month and calculates the percentage increase or decrease for the metric. The result is displayed as a percentage with a directional indicator to show whether the value increased or decreased.
This calculation uses full months only. It does not compare partial months or the current in-progress month.

For example, if unique users for March 1-31 are 1,200 and unique users for February 2026 are 1,000, then Month over Month is 20%. That means unique users increased by 20% in March compared to February.
First vs Last Full Month
First vs Last Full Month compares a metric from the first full month in your data with the last full month available. A full month is a month in which all days are complete. For example, if today is April 10, April is not yet a full month, so March is the last full month.
This comparison is useful for understanding growth or decline across the lifetime of the dataset. Suppose your data spans from January 1, 2026 to April 1, 2026.
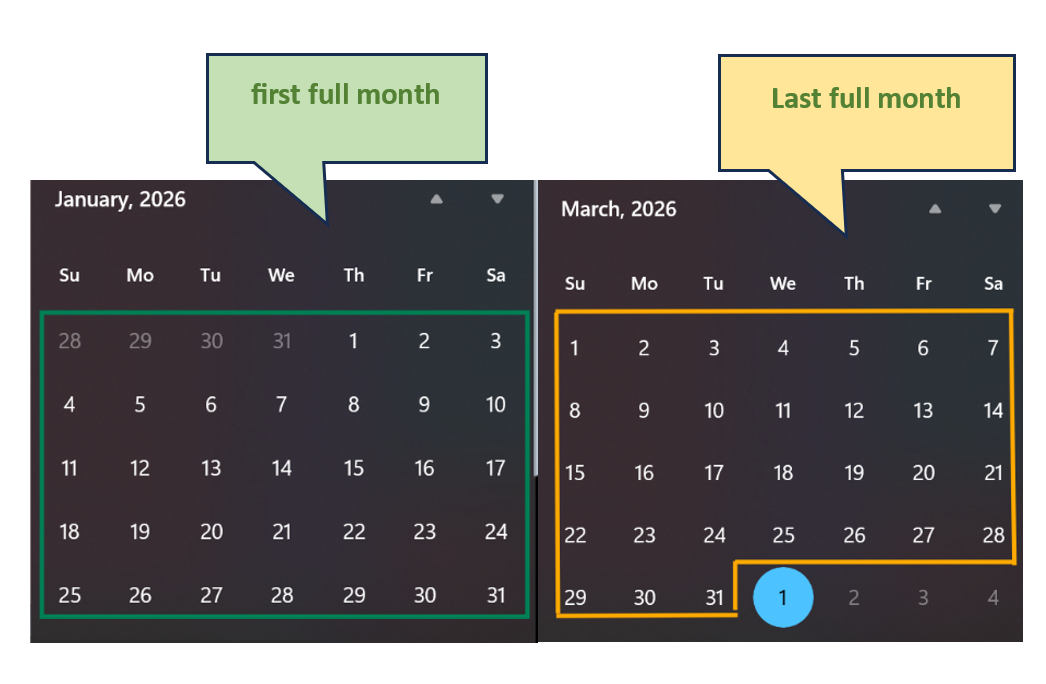
The table below illustrates this comparison using a simplified example.
| Month | Dates Highlighted | Sales per Day | Total Sales | Highlight |
|---|---|---|---|---|
| Jan 2026 | 1, 5, 15, 20, 25, 28 | 100, 120, 90, 80, 70, 60 | 220 | First Full Month |
| Feb 2026 | 2, 10, 18, 25 | 150, 160, 140, 130 | 580 | |
| Mar 2026 | 1, 10, 15, 20, 28, 31 | 210, 220, 230, 240, 250, 260 | 460 | Last Full Month |
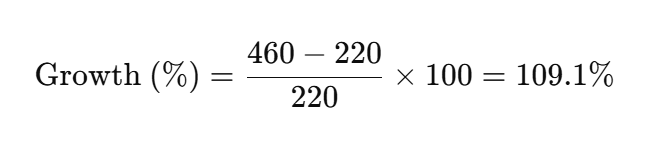
First vs Last Full Month growth calculation:

Year over Year
Year over Year compares a metric, such as sales, revenue, or users, for a specific period in the current year against the same period in the previous year. It is typically shown as a percentage change.
This method is useful for trend analysis because it accounts for seasonality and annual growth patterns. The current year does not need to be complete; you only compare the same duration across both years.
Example: If you have full revenue data for 2025 and revenue data for 2026 only through March, a Year over Year comparison uses January through March for both 2025 and 2026.

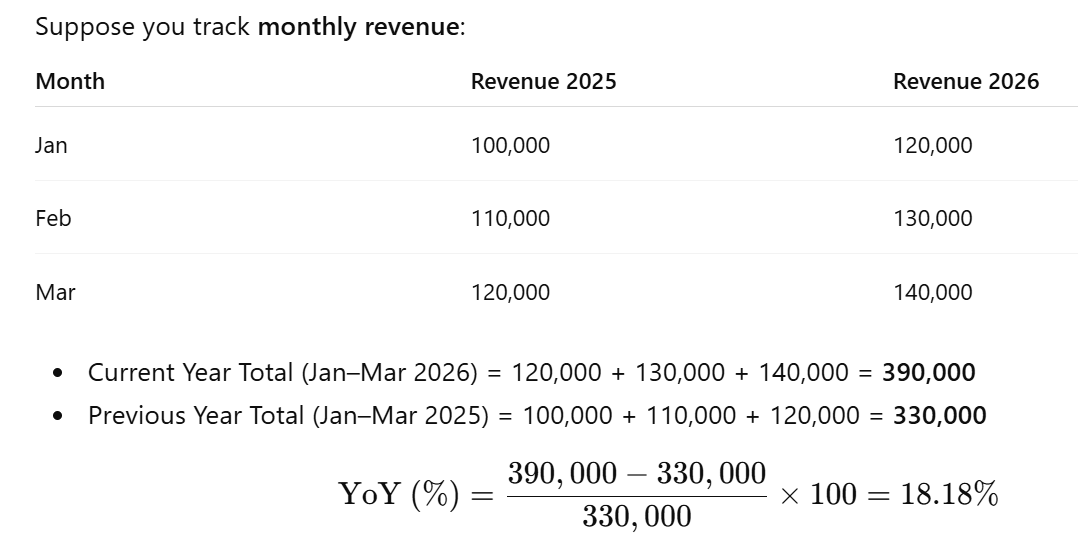
In this example, revenue from January through March 2026 increased by 18.18% compared with the same period in 2025.