
Home > tyGraph Support Articles > Mixing tyGraph with Other Sources in Power BI
この記事をダウンロードMixing tyGraph with Other Sources in Power BI
Each tyGraph model provides a focused and standardized view of your organization's data. In some cases, however, you may want to combine tyGraph data with another source. This article explains how to connect an existing tyGraph Power BI dataset to additional data sources.
Step 1: Prepare Power BI Desktop
Before you begin, make sure the following requirements are met:
-
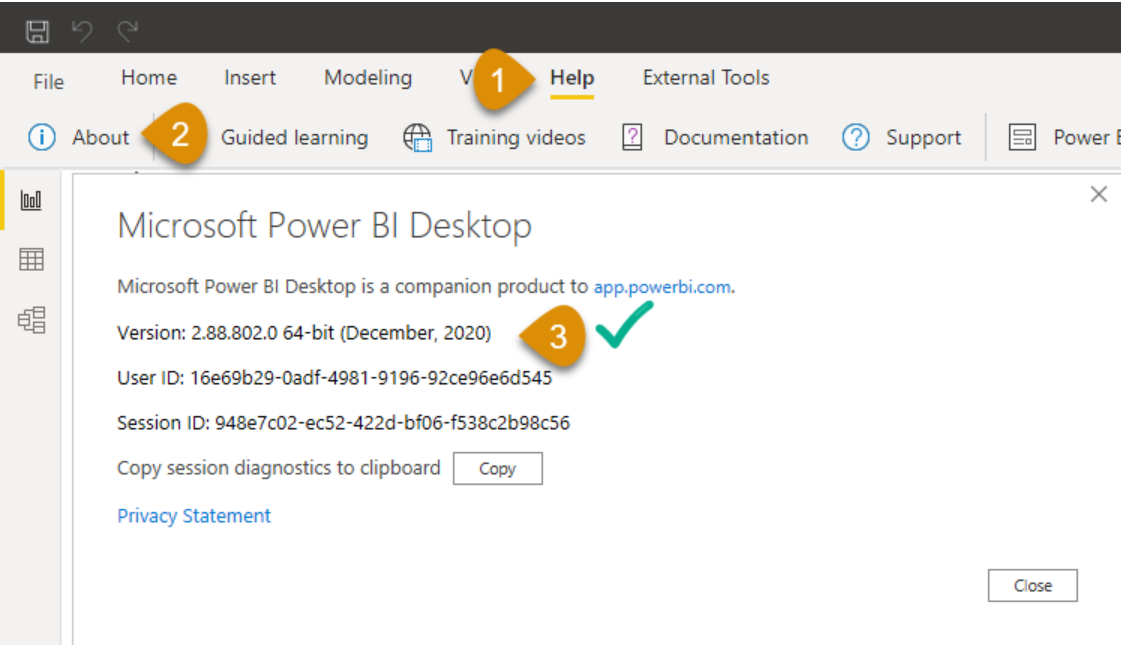
Start in Power BI Desktop and use at least the December 2020 release or later.
-
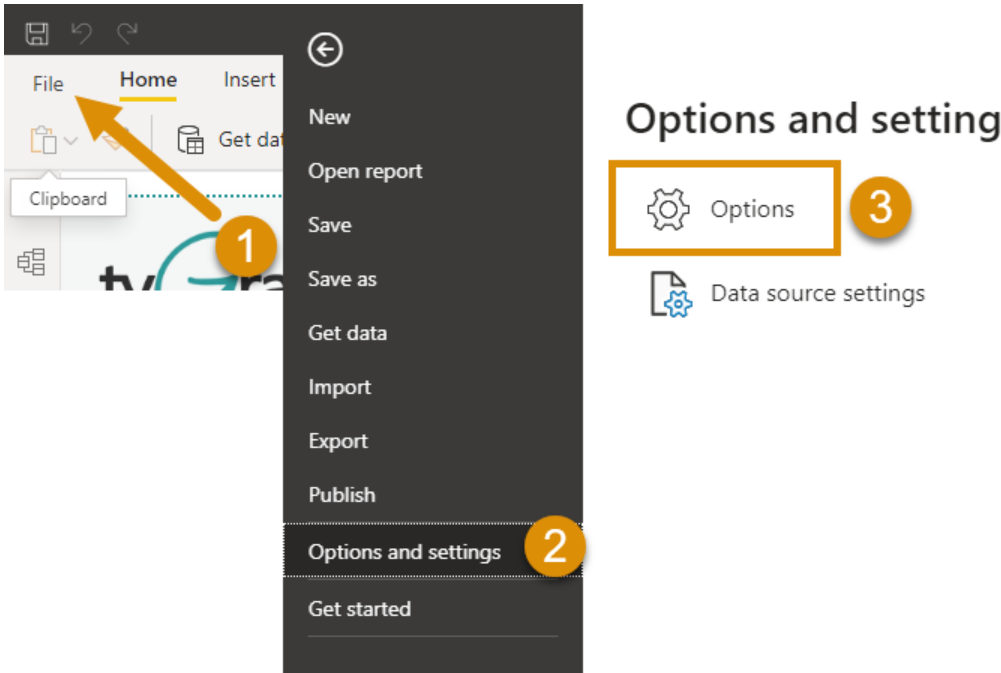
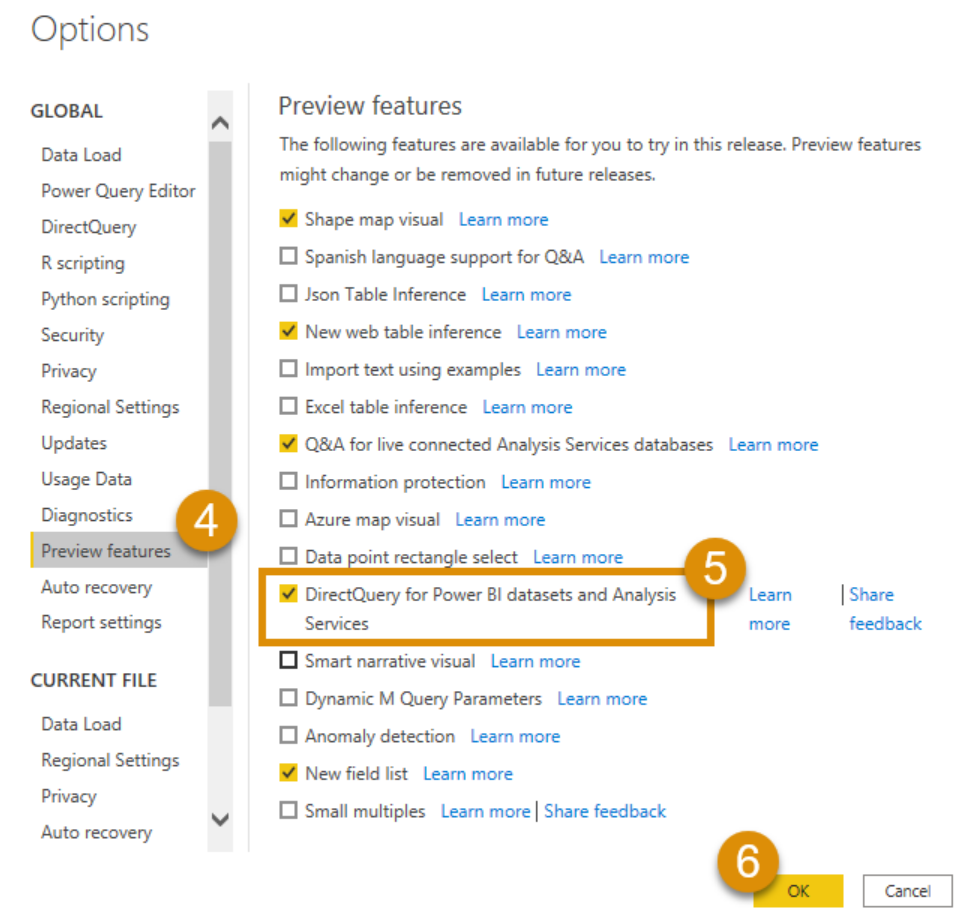
The DirectQuery for Power BI datasets and Analysis Services feature was previously required. This capability is now generally available, so you can skip this step. For additional background, see Announcing general availability for composite models on Power BI Datasets and Analysis Services models | Microsoft Power BI Blog | Microsoft Power BI.
-
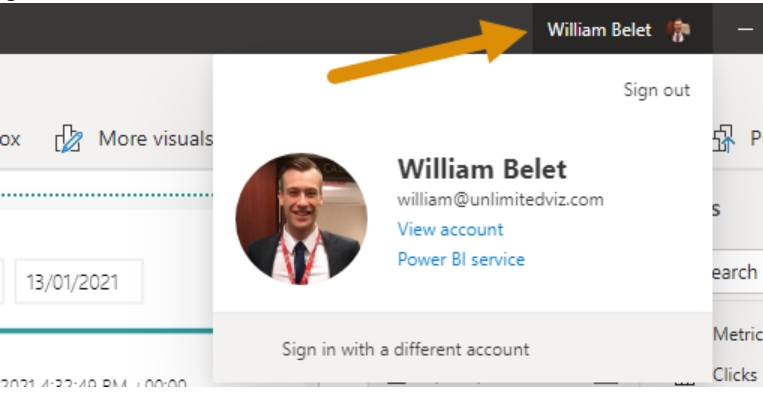
Sign in with your Microsoft 365 account. This is required to connect to content in the Power BI service.
Step 2: Choose Your Starting File
You can begin with a blank Power BI Desktop model if you want to build report layouts from scratch. If you want to extend the default tyGraph report experience, we recommend downloading a live-connected template for the product and layouts you plan to use. This preserves the default visuals and formatting so you do not need to recreate them manually.
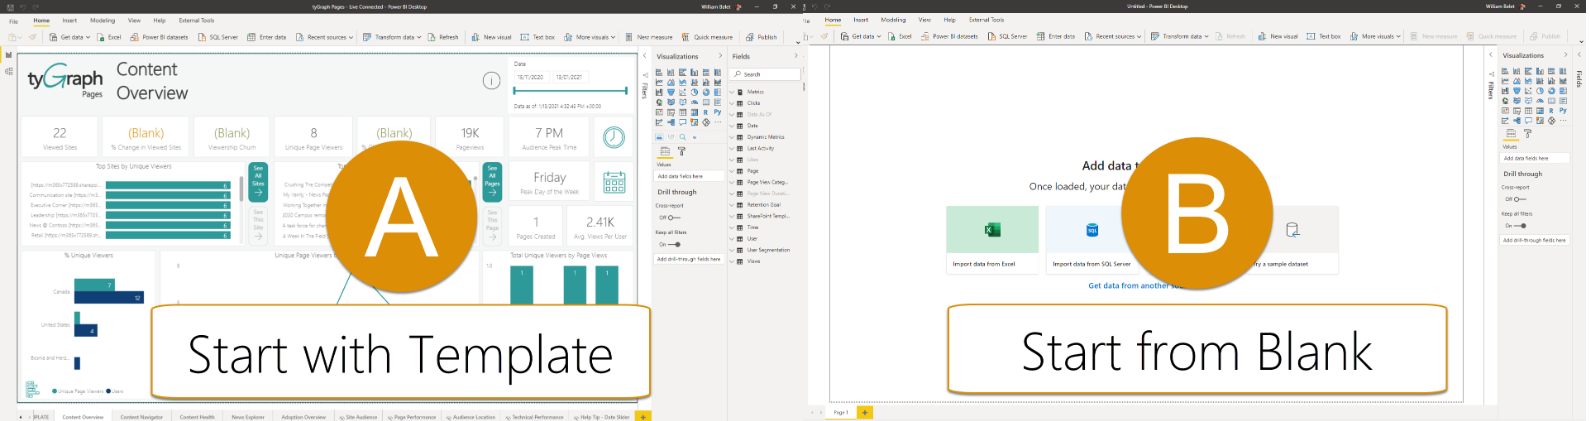
For example, if you want to add an extra user table to a tyGraph Pages dashboard, start with that product's template so you can add your custom data while preserving the existing look and feel.
Step 3: Connect the First Dataset
If you are using a template file, open it from your downloads. If you are starting from scratch, select Get data > Power BI datasets, then continue to Step 4.
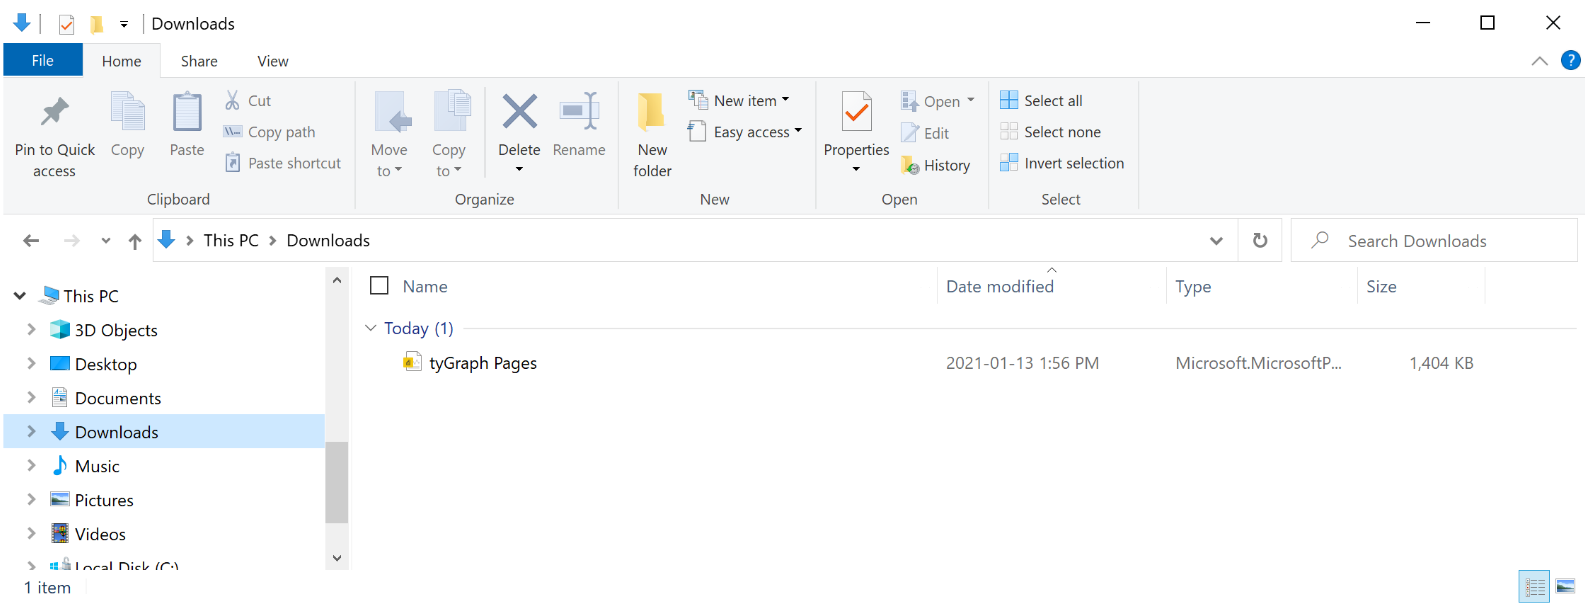
-
Sign in to Power BI if you are not already signed in. You may be prompted to enter your email address.
-
You may see an Unable to connect message. This is expected in this scenario.
-
Click Edit.
-
Search for and select the matching product dataset.
-
Click Create and allow the report to refresh.
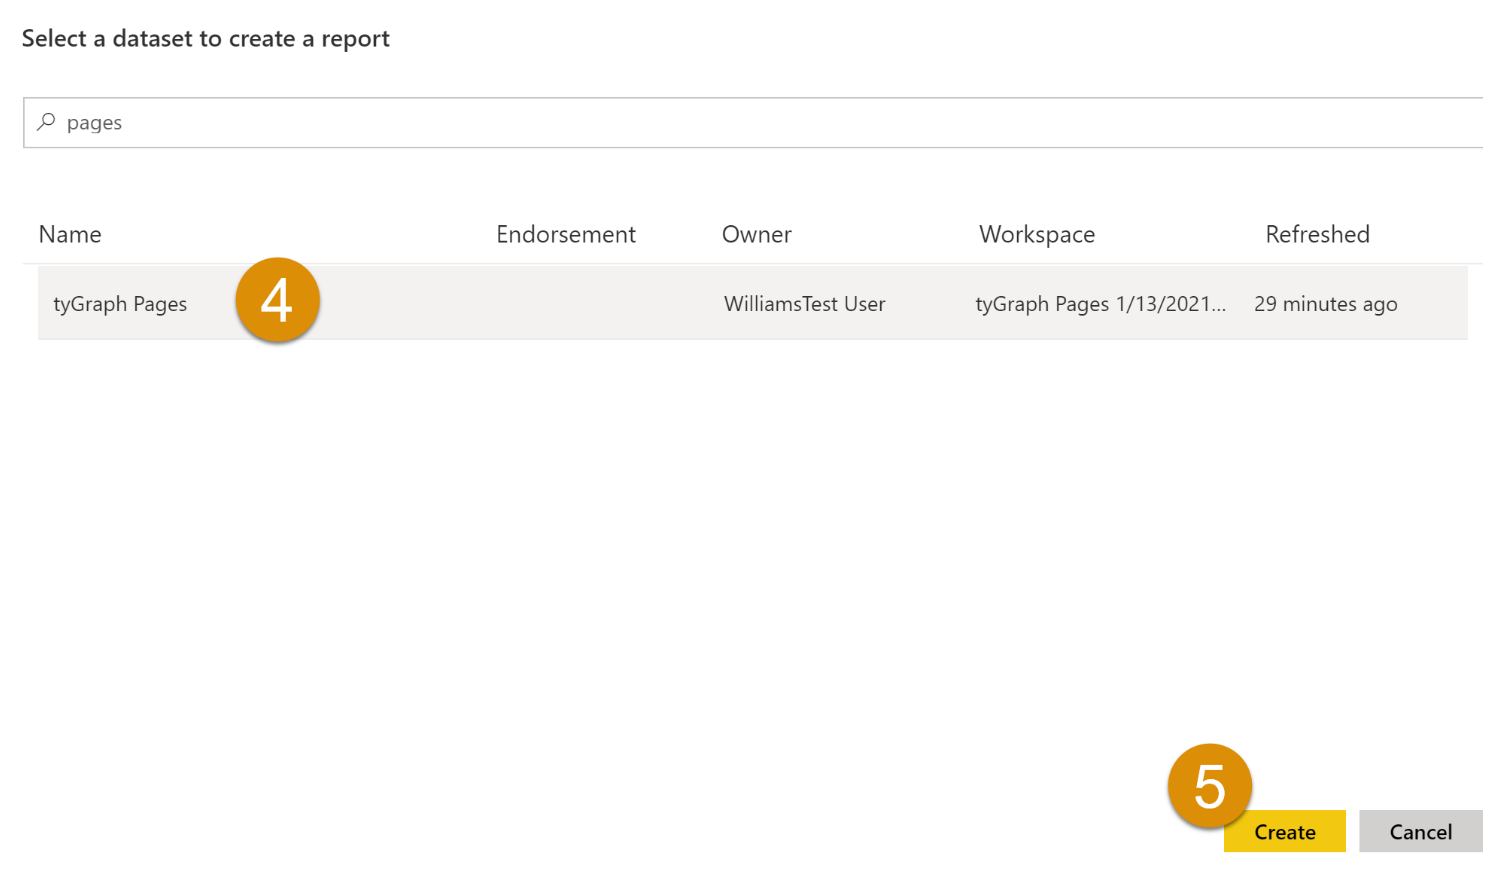
When this is complete, you should have a model that is live-connected to tyGraph data and ready for additional sources.
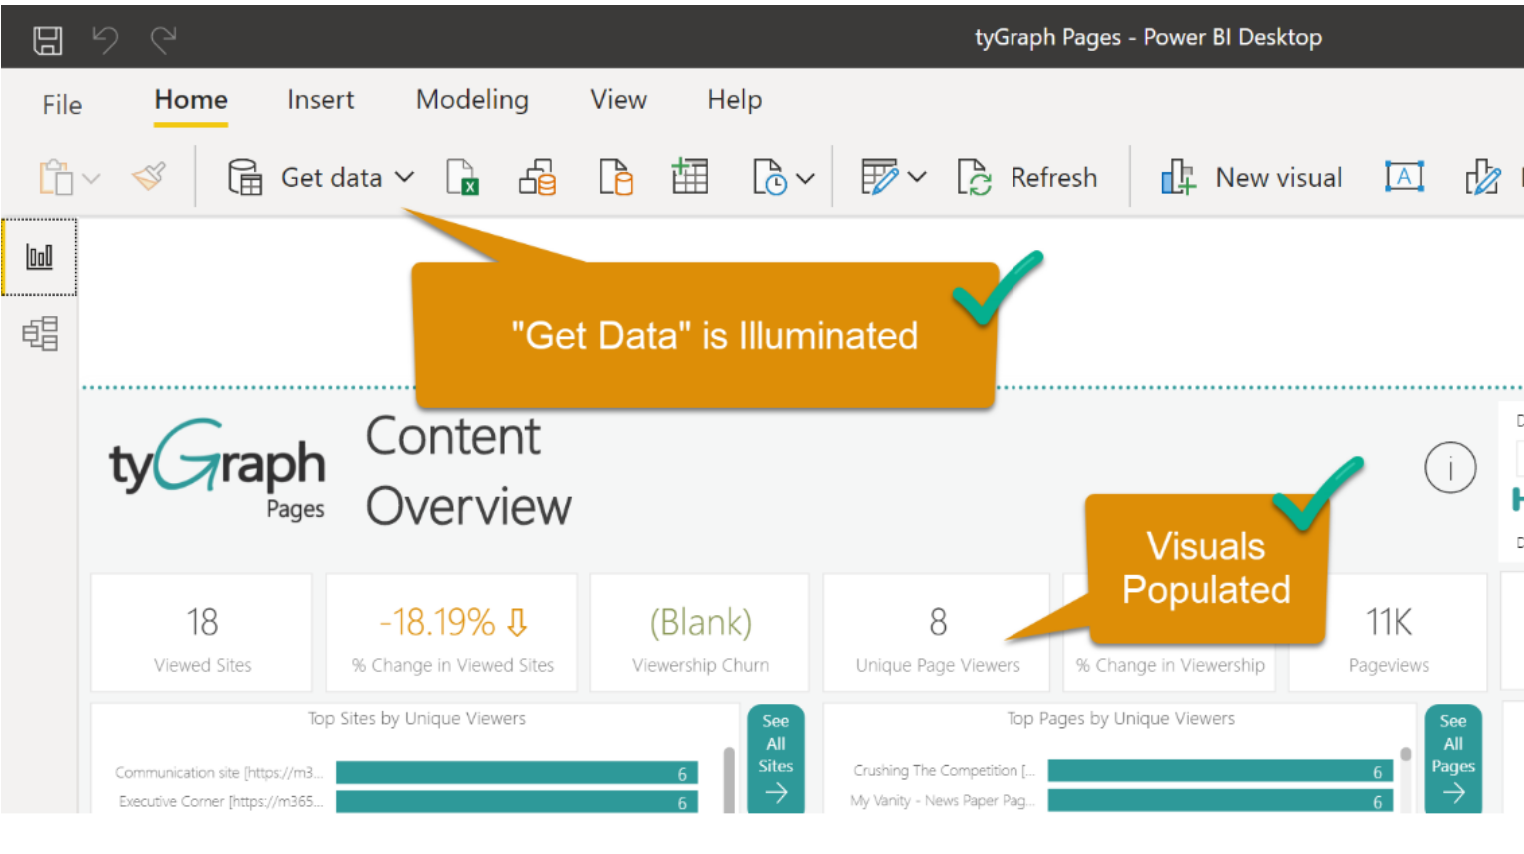
Step 4: Add an Additional Data Source
You can now add your own data to the model.
-
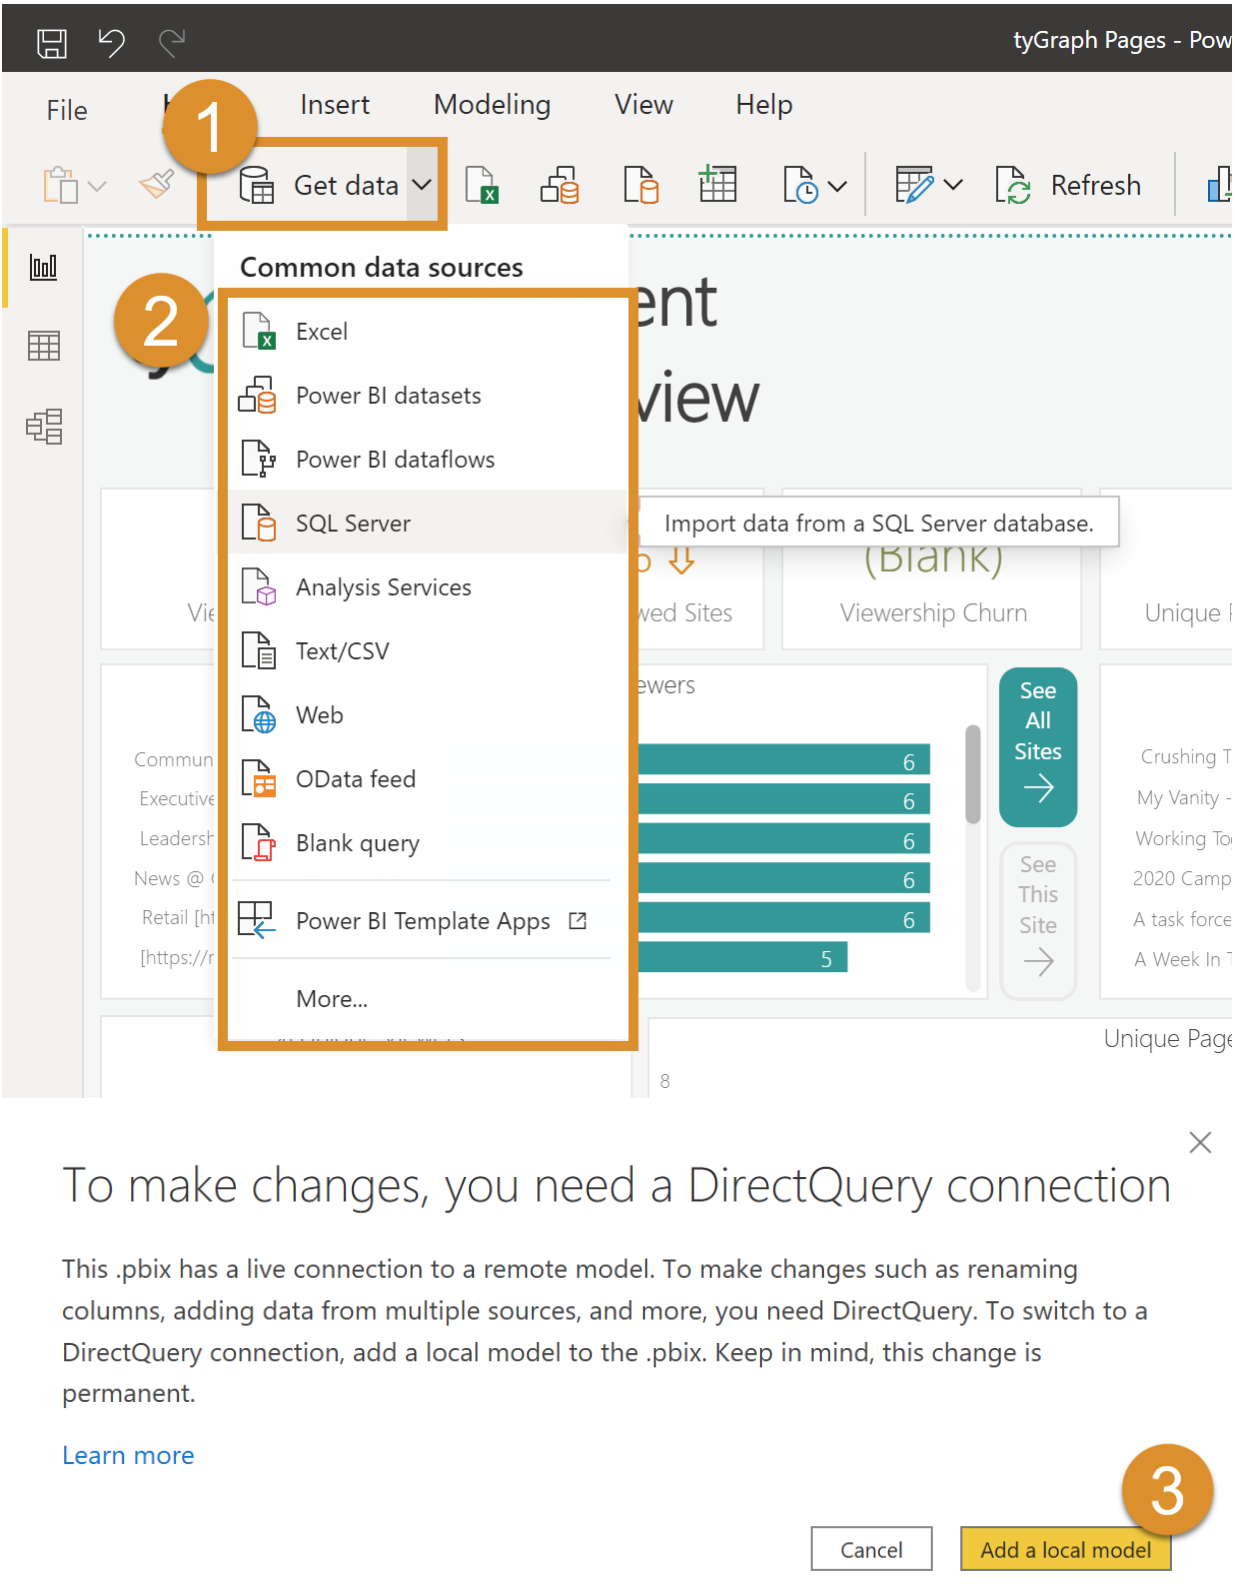
Click Get data at the top of Power BI Desktop and select the data source you want to add.
-
After selecting the source, click Add a local model to confirm.
-
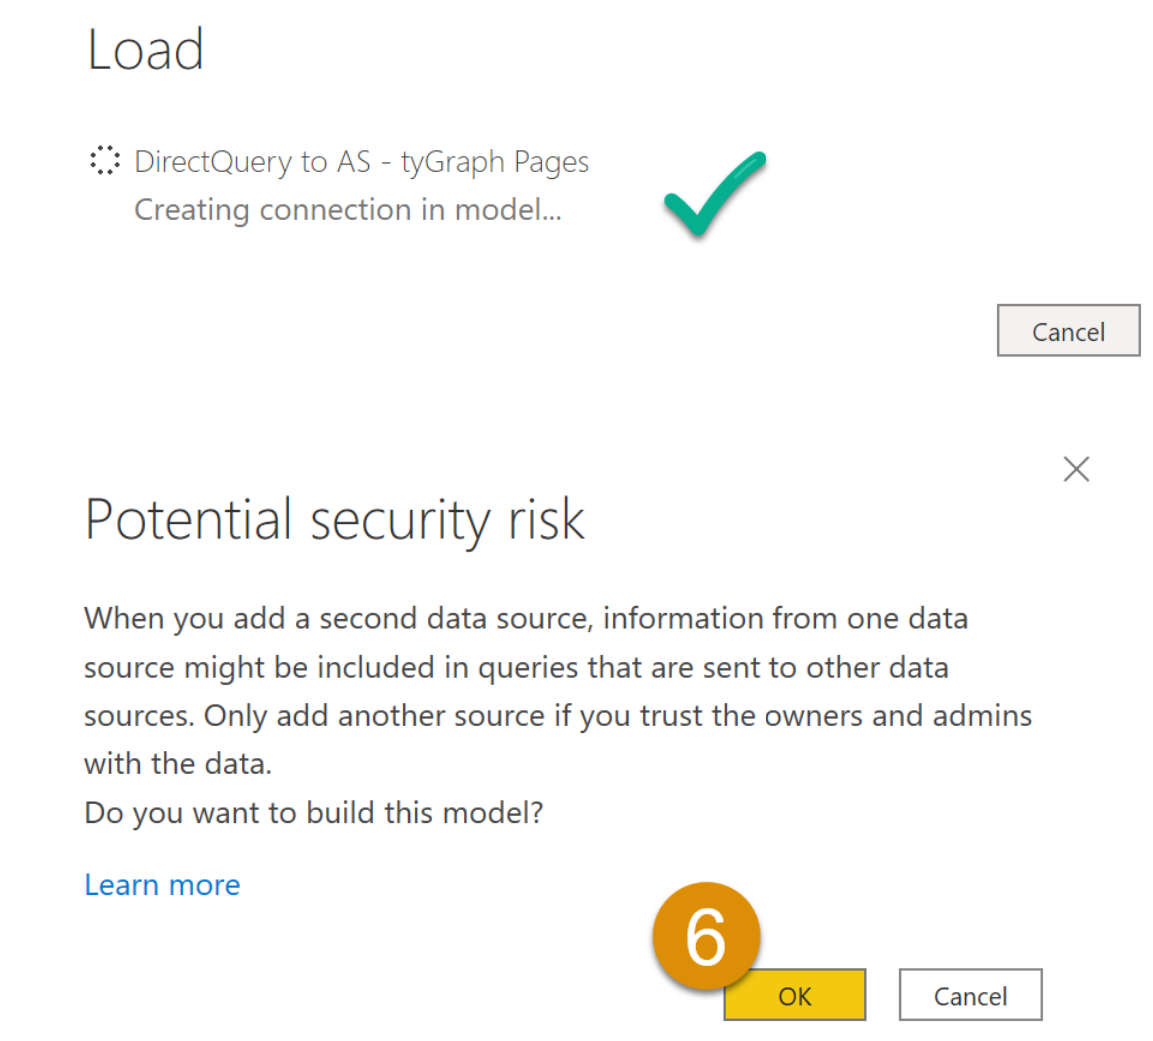
The dataset will be converted to an Analysis Services model. You should see a confirmation message.
-
Authenticate to the selected source. Common examples include Azure SQL attributes, Excel files, or another Power BI dataset.
-
After authentication, click OK when the warning message appears.
Step 5: Model and Publish
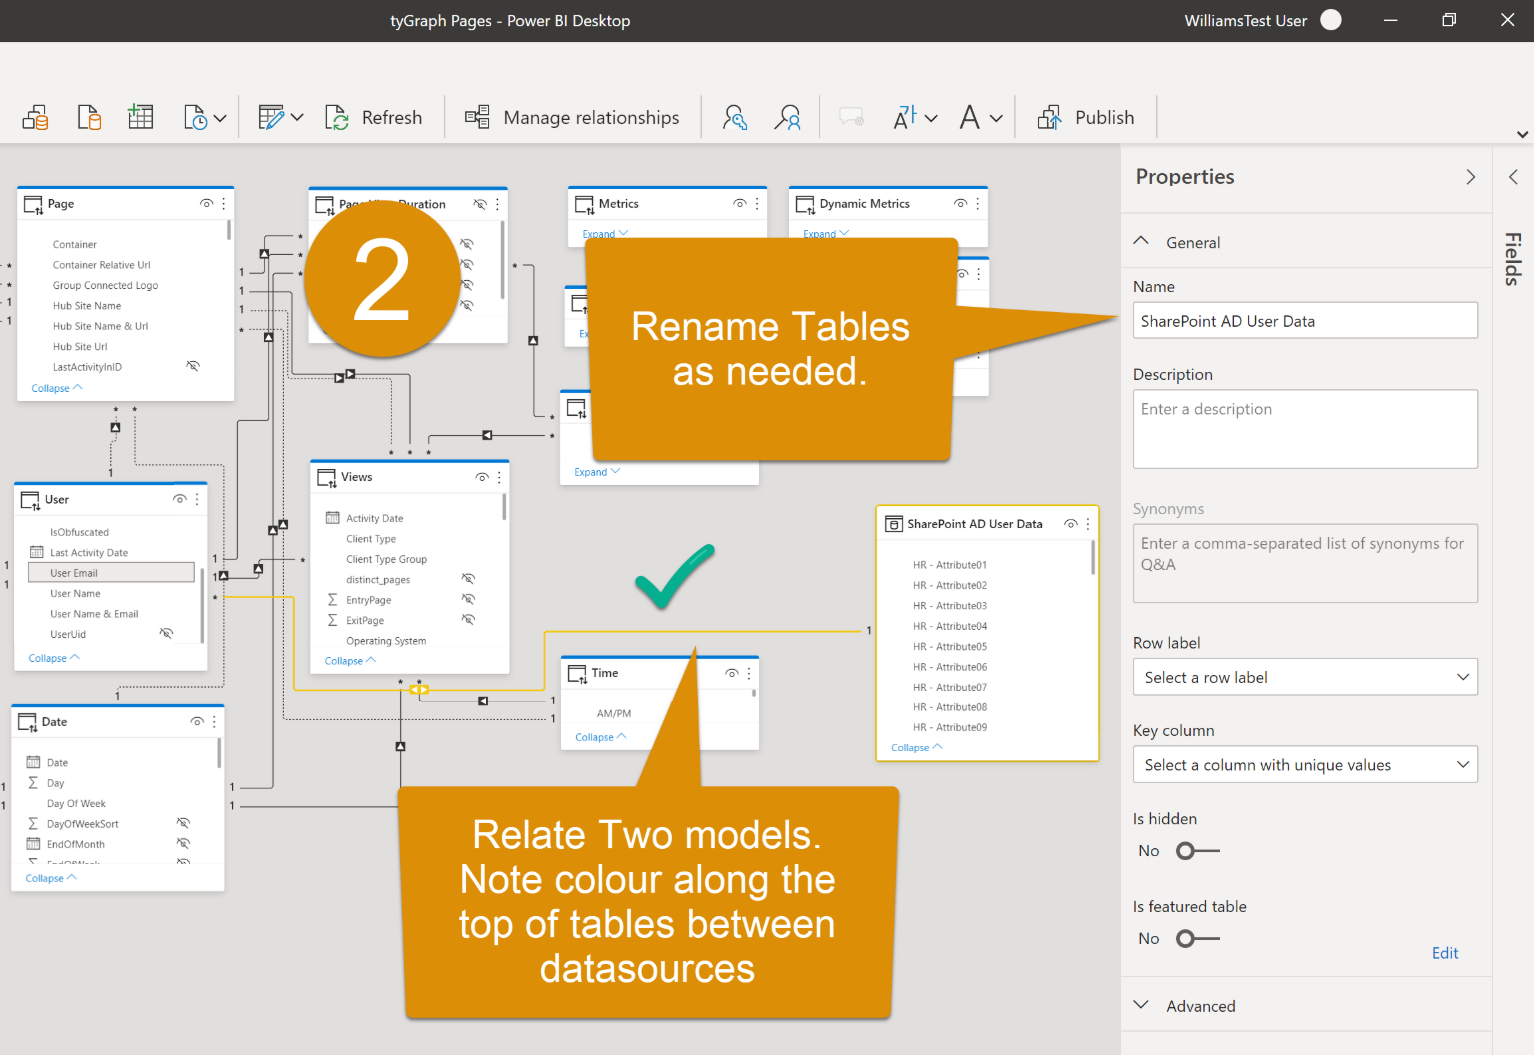
After all sources are imported, you can build new model relationships on top of the combined data. At a minimum, this usually means creating relationships between the new tables and the tyGraph dataset. For user-related data, a join on Email or UPN is common.
-
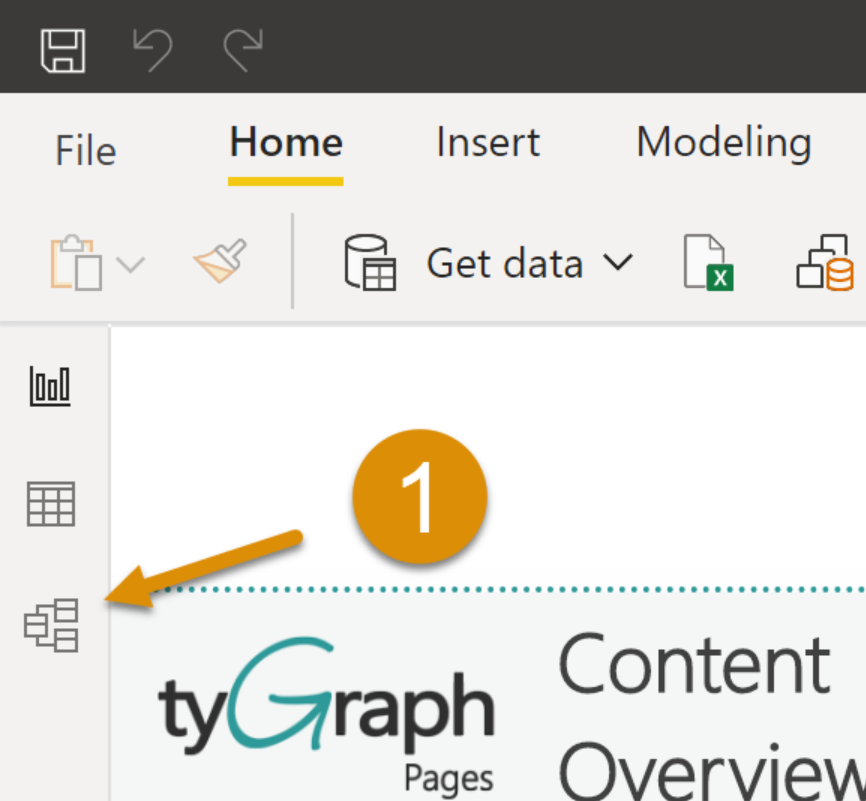
Open relationship view.
-
Create the required relationships.
-
Add new filters or pivots based on the added attributes.
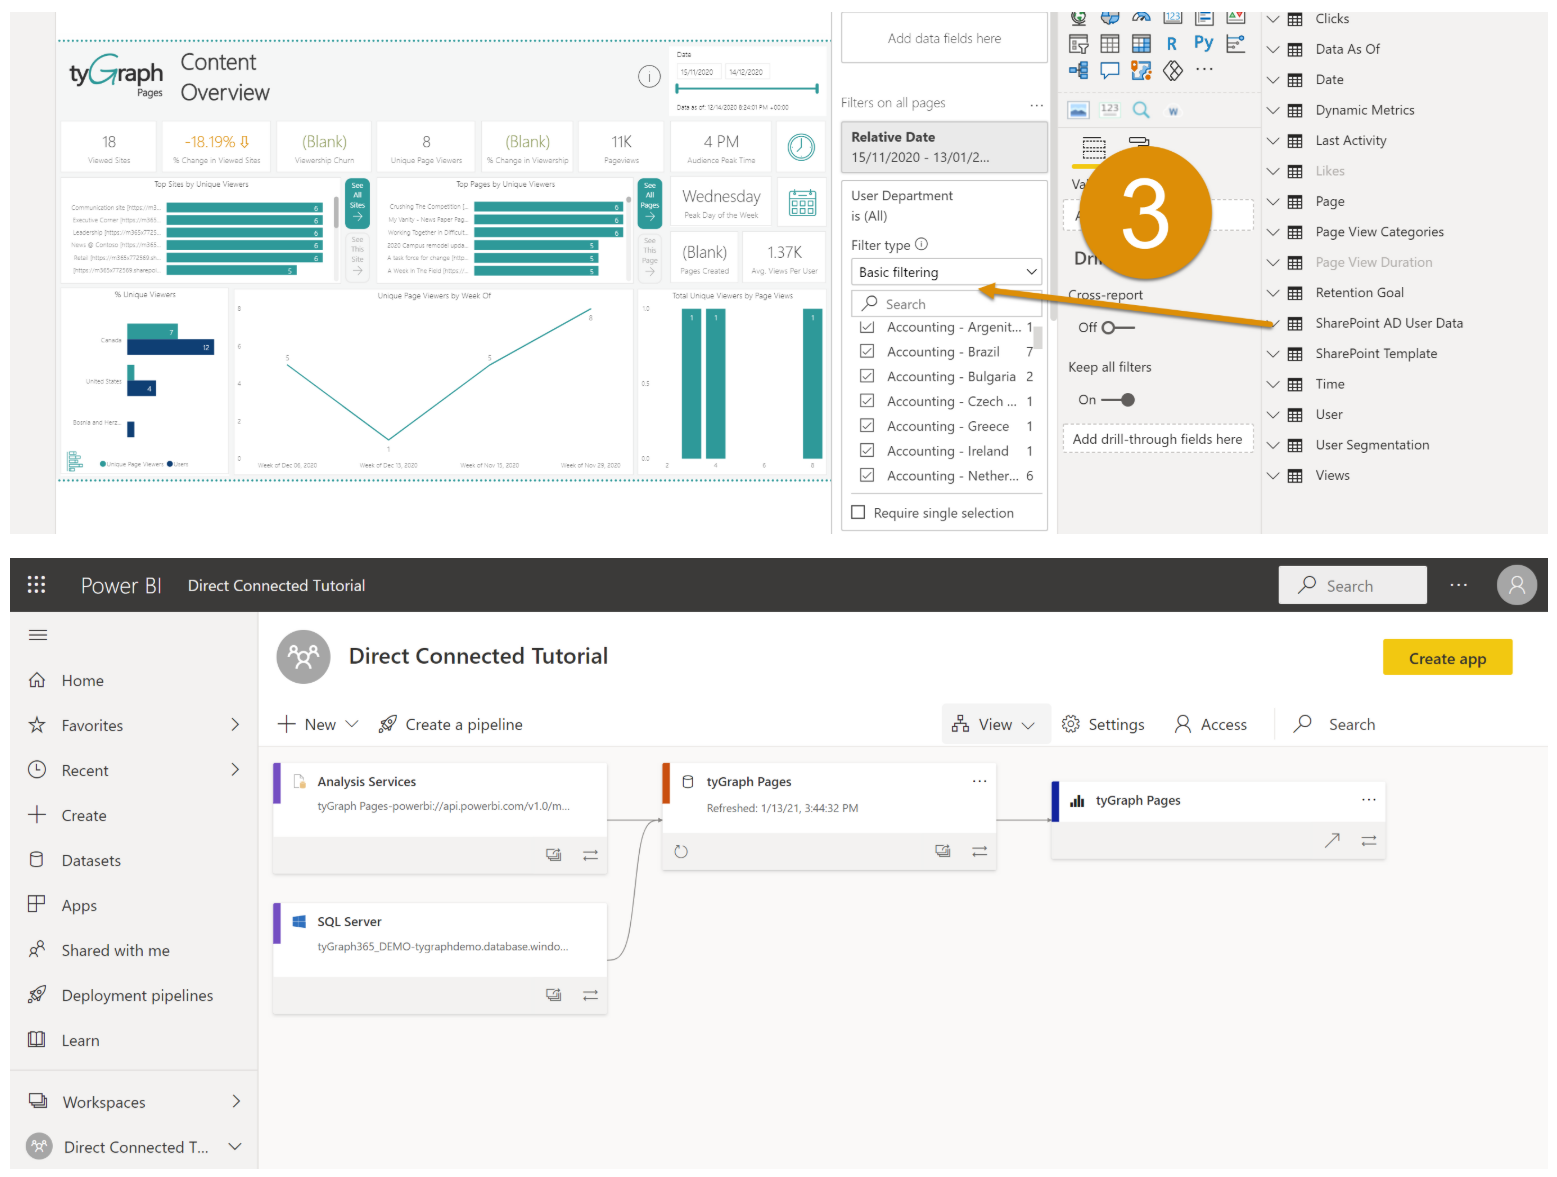
-
When you are finished, publish the report to the Power BI service. You may need to configure refresh settings for any sources that are not already managed within the service.
Summary
If you want to combine external data with tyGraph, composite models in Power BI are the recommended approach. This method keeps the primary data in the Power BI service, which supports a more secure, centrally managed, and maintainable deployment.