
Home > tyGraph Support Articles > Slow Pages and Avg. Page Load Times
この記事をダウンロードSlow Pages and Average Page Load Times
In tyGraph SharePoint Analytics, we highlight pages where the average load time exceeds 5 seconds. Avg. Page Load is based on the timing data reported to Azure Application Insights, measured from the point when the user's browser sends the request until the page load event completes. Average page load duration is displayed in the format HH:MM:SS.mmm.
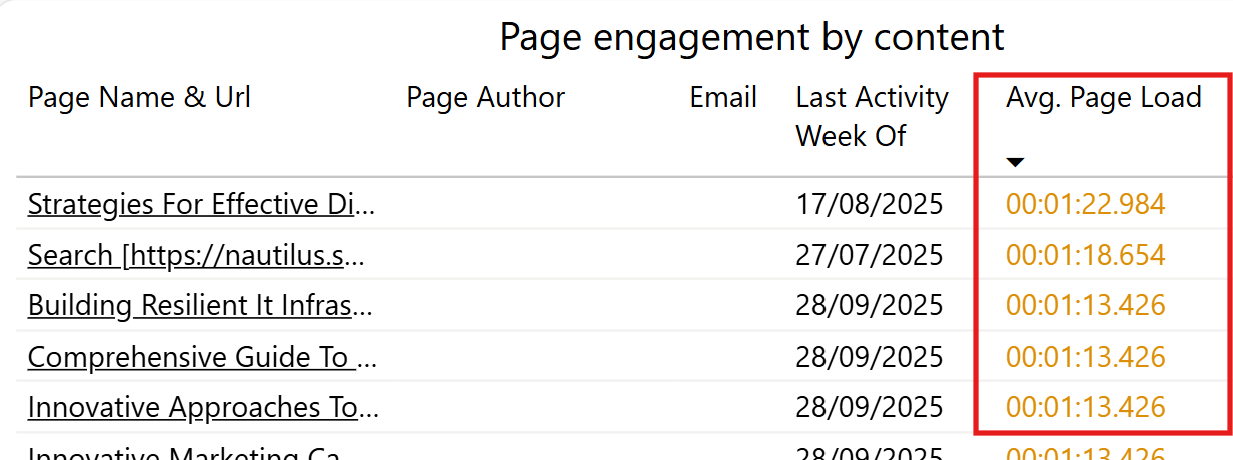
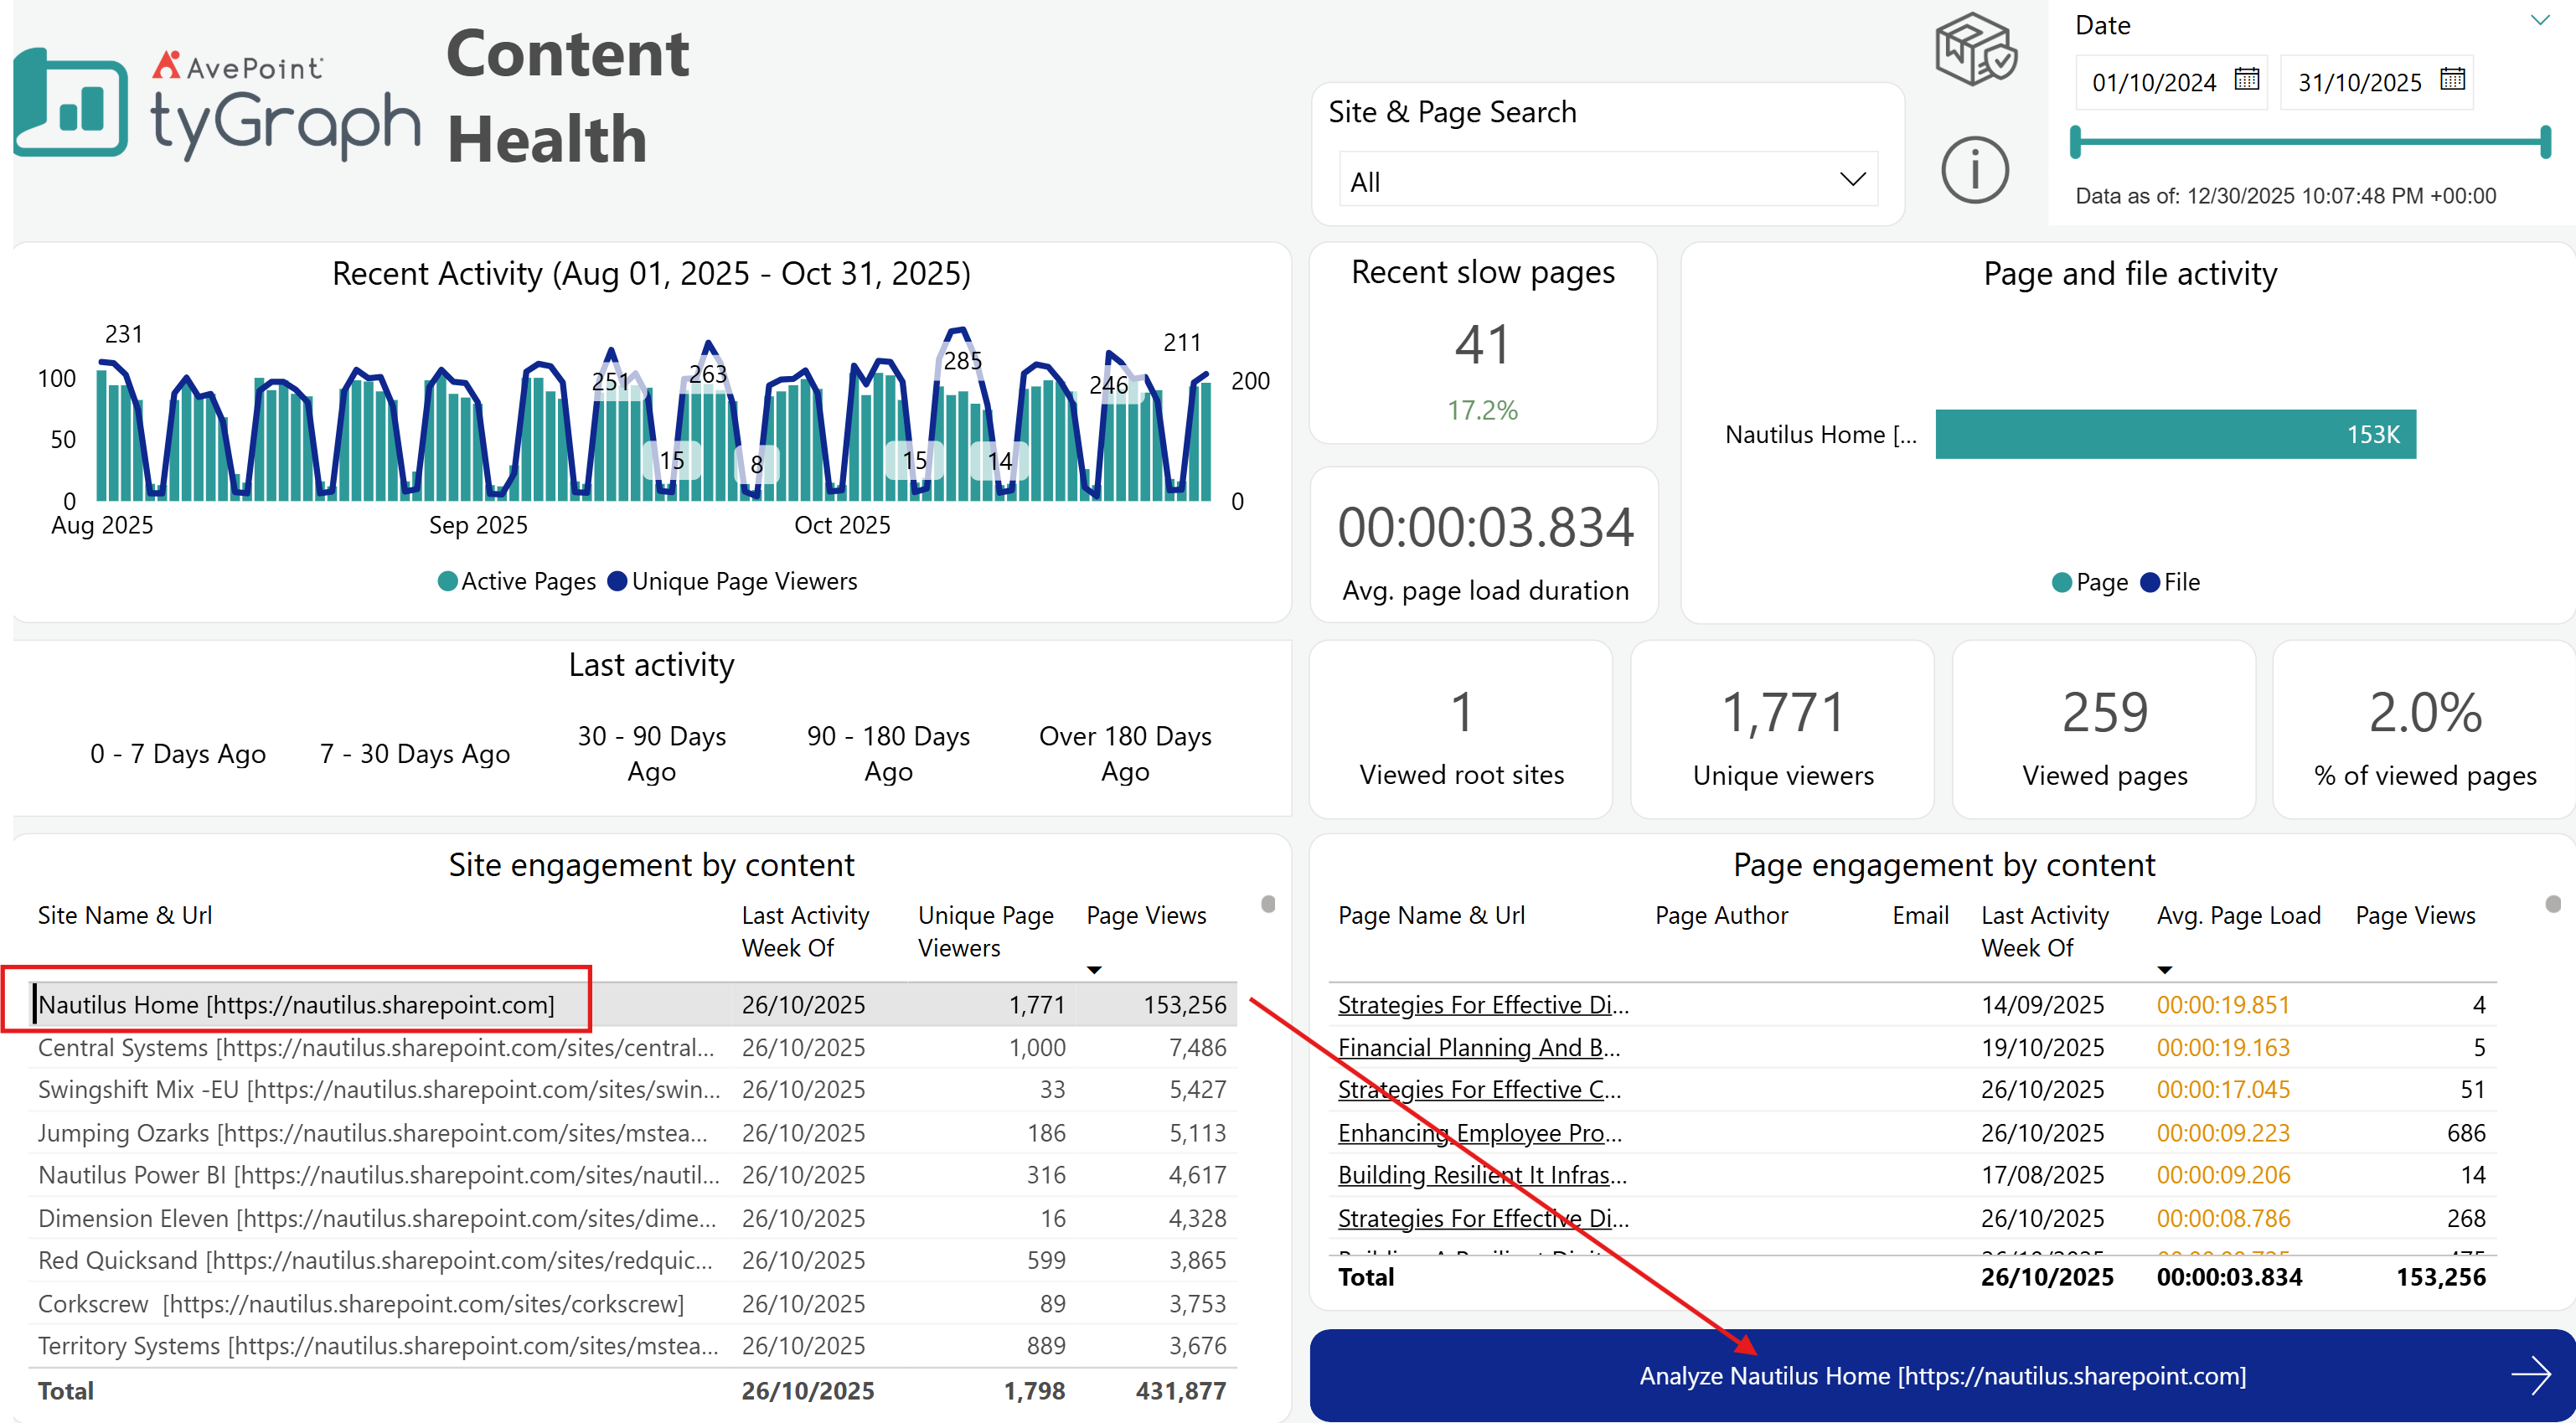
Page load times can be affected by internet quality, VPN usage, browser settings or extensions, and device performance. When reviewing slow pages, it is important to examine the available context, including users, views, geography, and date range. From the Content Health report tab, select the site you want to review and click Analyze.
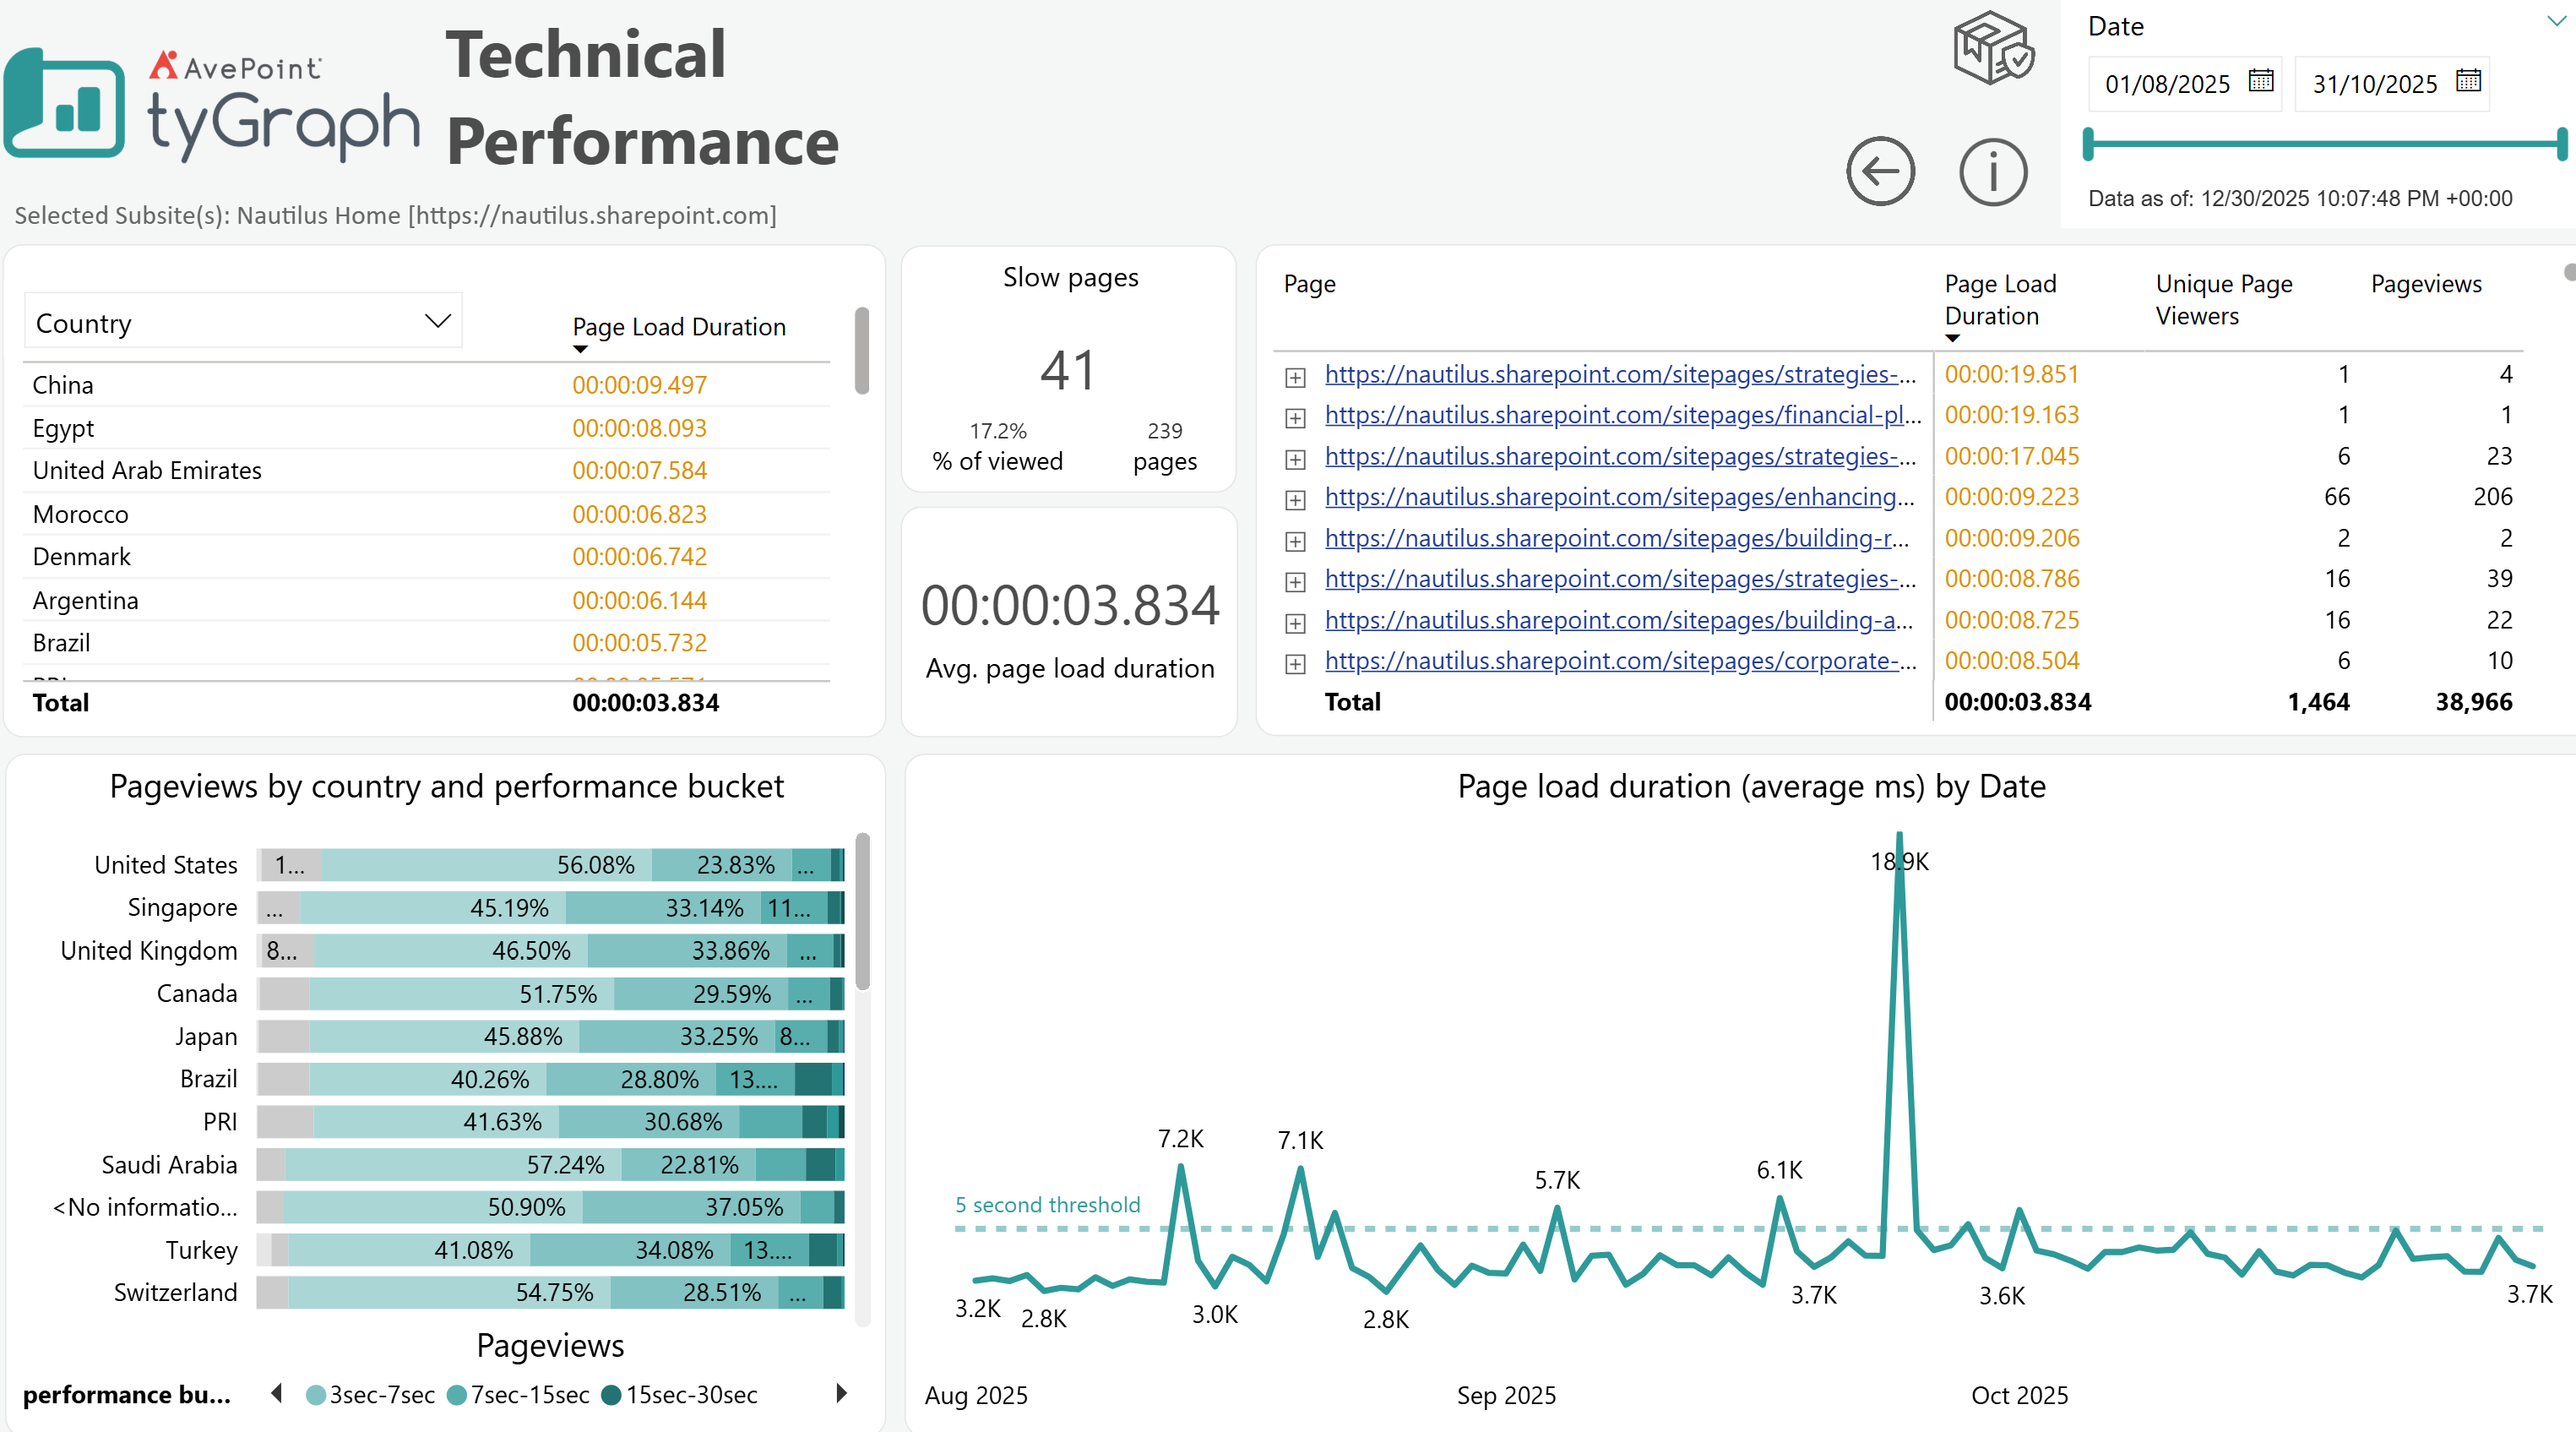
On the Technical Performance report tab, you can review the following details:
-
Users, views, and page load durations to help measure the impact of the slow page.
-
Geography by performance bucket to help establish regional performance baselines. In the example shown, Brazil appears to have the slowest load times.
-
Load duration trends over time to help identify outliers and recurring performance issues.
If a page is consistently slow, consider using the Page Diagnostics for SharePoint tool. It can help you troubleshoot performance issues and identify optimization opportunities.